ParaView · VTK · Catalyst · CFD & FEM post · in-situ HPC

I turn terabyte-scale simulations into pictures scientists can defend.

A decade across ParaView, VTK, Catalyst, CFD and FEM post-processing. Most of my pipelines are scripts because a state file you can diff is a visualization you can reproduce.

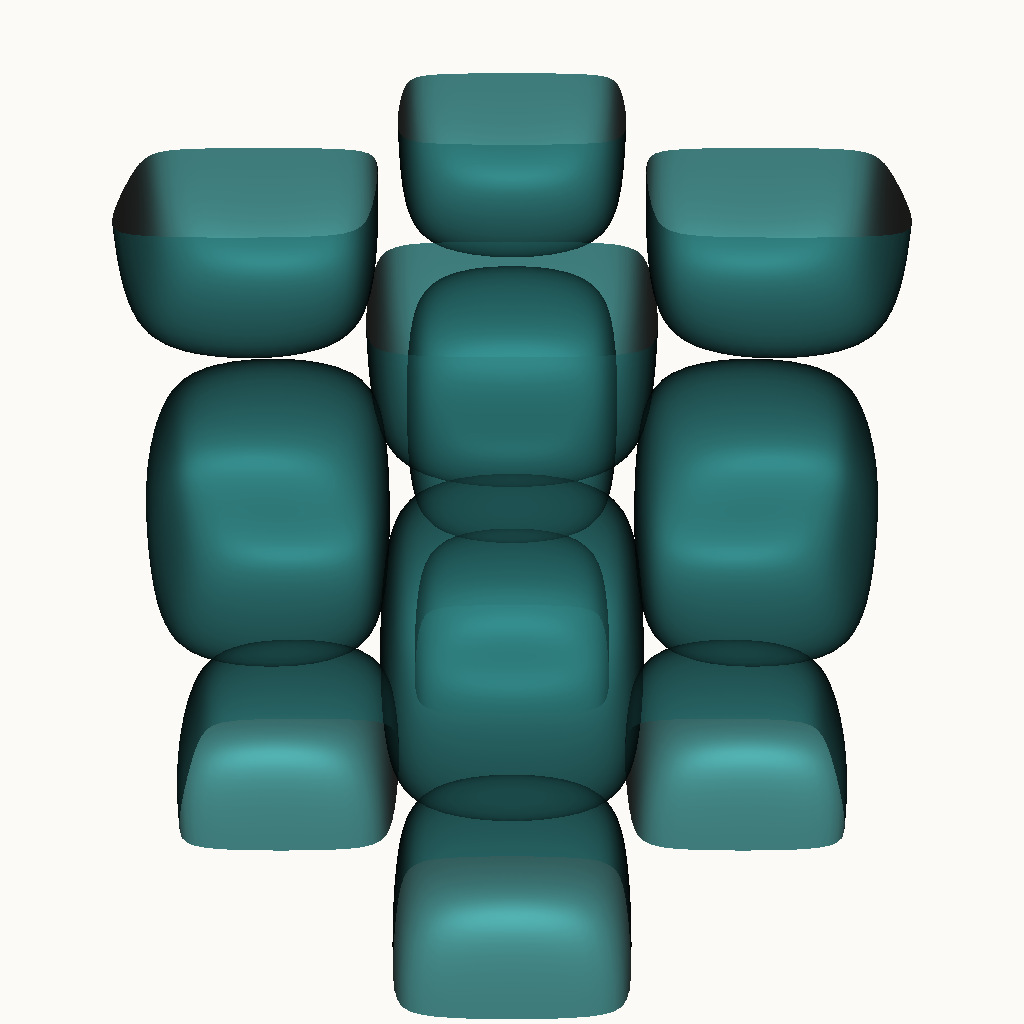
Q-criterion isosurface of a Taylor-Green vortex, rendered in VTK
Q-criterion isosurface of a Taylor-Green vortex — rendered live from render_figures.py
ParaView VTK Catalyst v2 pvpython / pvbatch CFD post (OpenFOAM, SU2) FEM (Abaqus, CalculiX, FEniCS) Volume rendering In-situ HPC XDMF / CGNS / EnSight Plugin development Python · C++ MPI / GPU rendering

Selected projects

Five projects that together cover the scientific-visualization stack — from raw simulation data through interactive analysis, custom filters, and in-situ pipelines that run inside the solver.

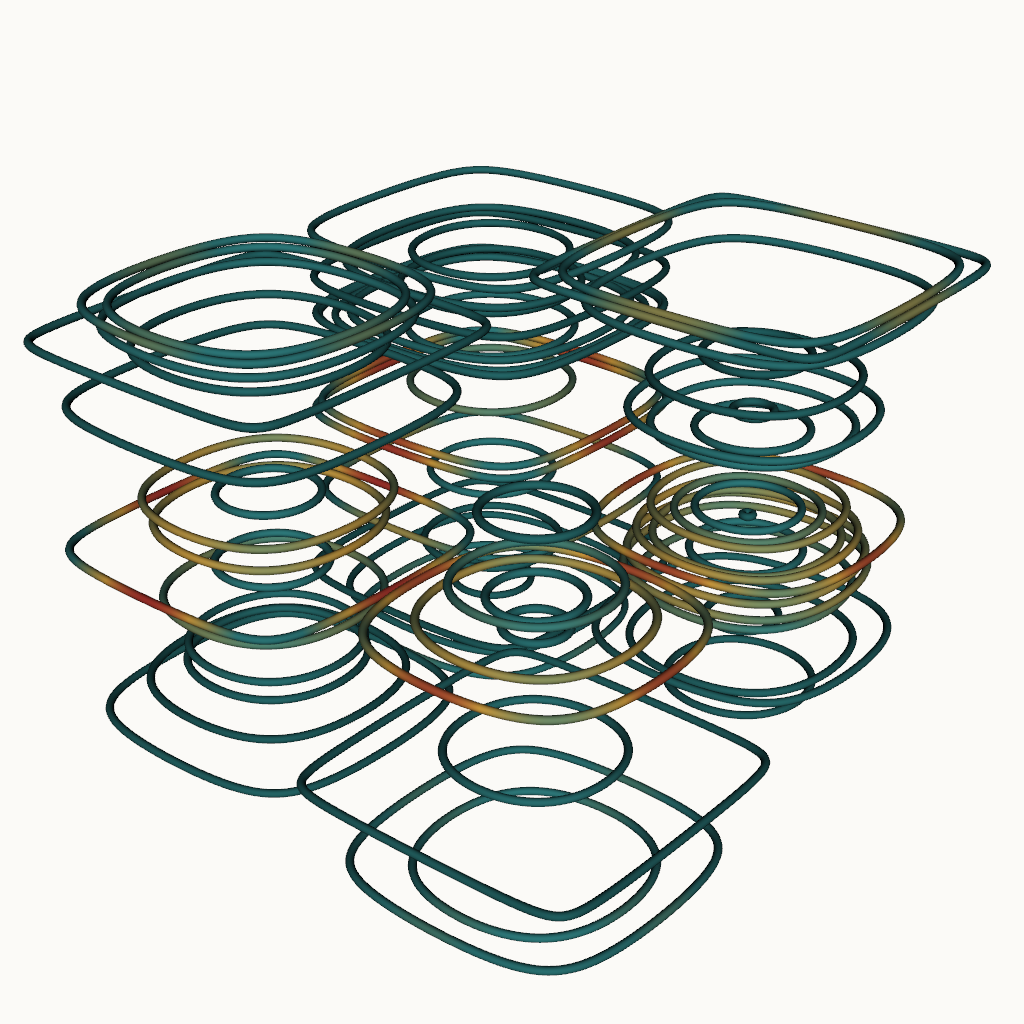
RK4 streamlines through a Taylor-Green vortex, colored by velocity magnitude

CFD post · vortex identification · VTK

Turbulent flow visualization (Taylor-Green vortex)

The reference workload for any CFD post-processing pipeline. A 64³ analytic vortex field, a Q-criterion derived from velocity gradients, an isosurface for vortex cores, and RK4-integrated streamlines tubed and colored by speed. Every step is scripted — .vti output drops straight into ParaView.
64³ grid · Q-criterion · RK4 stream tracer · custom teal→amber transfer function · all rendered headlessly from VTK

Read the case study →
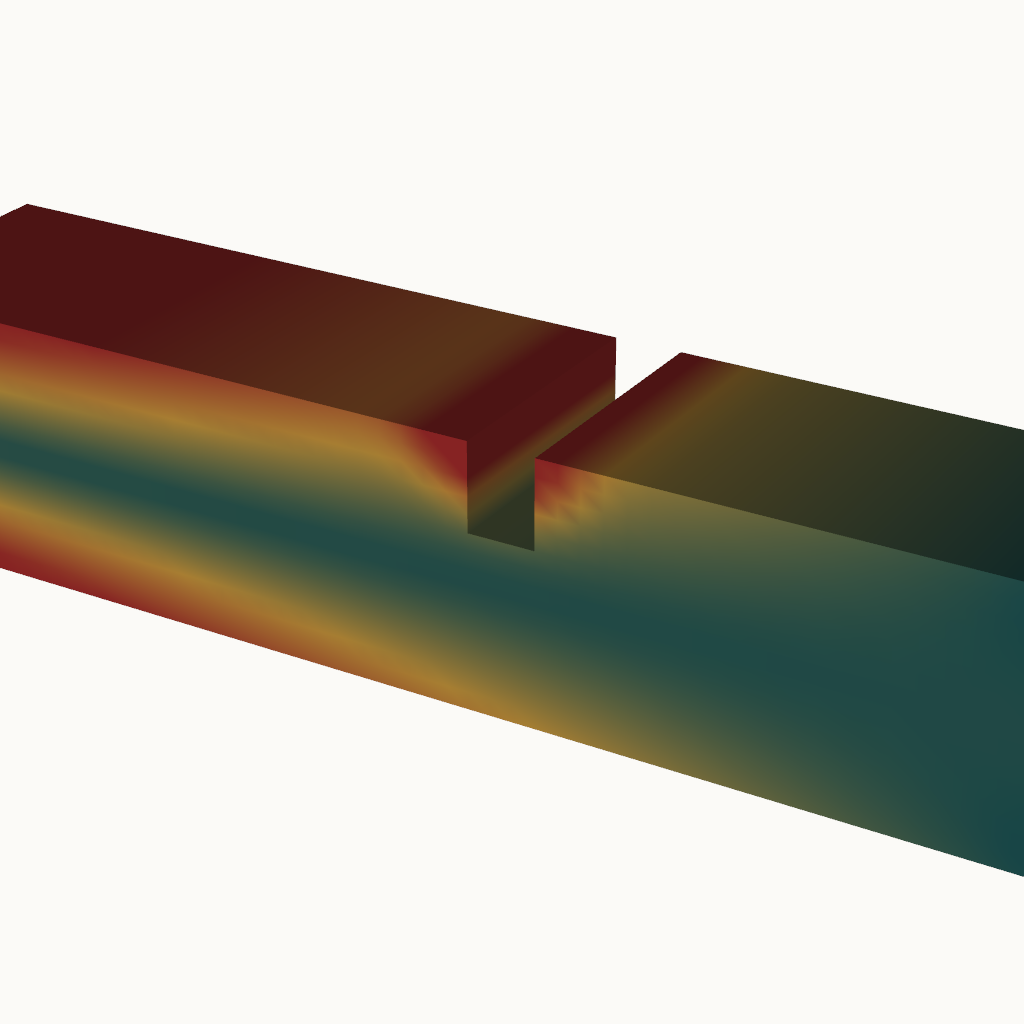
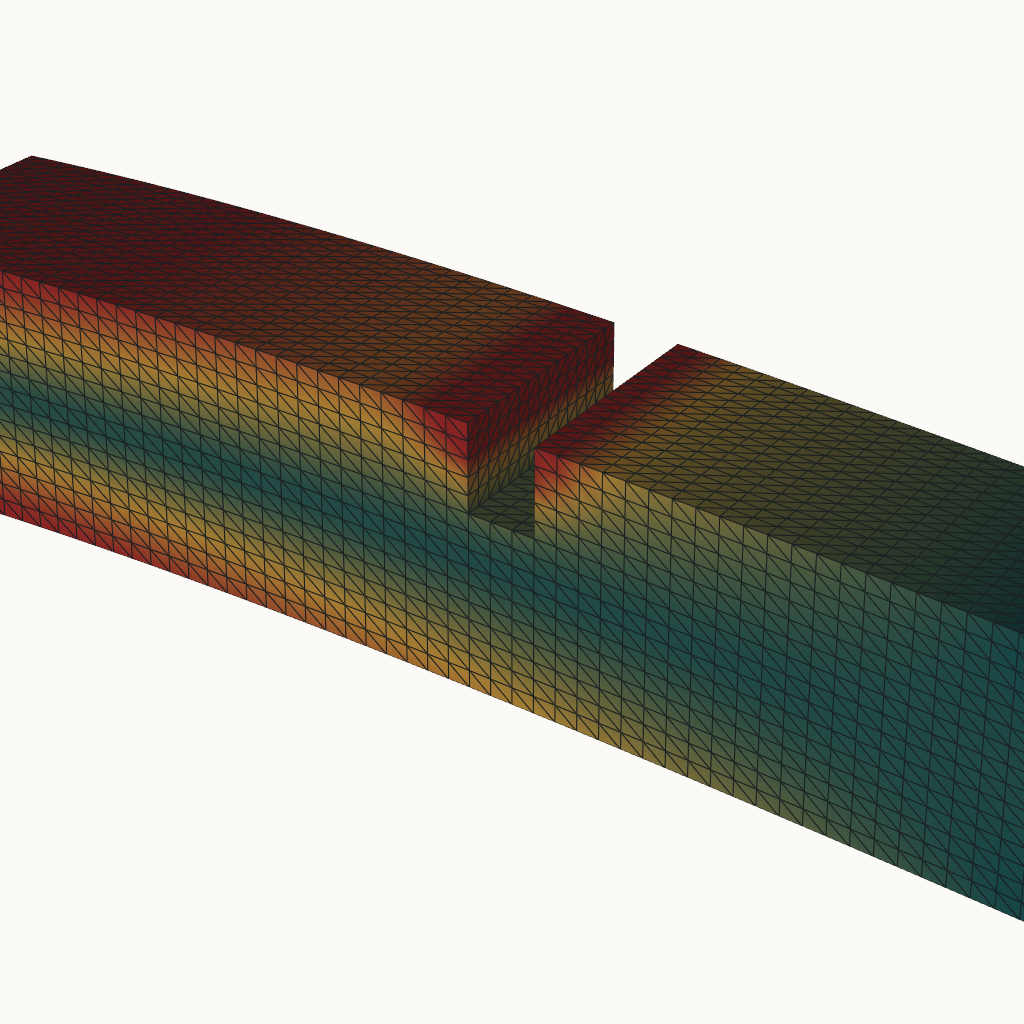
Notched cantilever beam, mesh visible, warped by displacement and colored by von Mises stress

FEM post · unstructured mesh · warp-by-vector

FEM stress field on a notched cantilever

End-to-end FEM-to-ParaView workflow: build a tetrahedralised notched beam (~78k cells), attach a mechanically consistent stress tensor with a notch concentration, derive the von Mises invariant per point, and render both the static field and the warped deflected shape. Includes the percentile clip every junior engineer learns the hard way.

78,300 tets · σ_xx, τ_xy, von Mises, displacement · binary .vtu · 5–95 percentile colormap clip

Read the case study →
Volume rendering of a synthetic atmospheric plume

Volume rendering · transfer functions

Volumetric scalar field — atmospheric plume

96³ procedural plume, exported to .vti, rendered with a hand-tuned color + opacity transfer function. Companion isocontour view at three nested levels for quantitative readability.

Case study →

Plugin · vtkPythonProgrammableFilter

ParaView custom plugin — vorticity + auto seeds

Server-manager XML proxy plus Python module that adds a single new filter: compute vorticity on any vector array on any topology, and emit the top-N highest-vorticity points as a vtkPolyData ready for Stream Tracer With Custom Source.

Case study →

Catalyst v2 · in-situ · HPC

Catalyst in-situ pipeline

A toy time-stepping driver and a Catalyst v2 adaptor that contours, color-maps, and screenshots in-process — the strategy whenever the solver produces more data per step than disk can hold.

Case study →

Code you can actually run

Every figure on this page is regenerated by GitHub Actions on every push — never pre-baked. No proprietary data, no commercial solver licenses required. Clone the repo, install VTK, get the same picture.

Taylor-Green vortex — VTK

python scripts/python/taylor_green_vortex.py

Builds the 64³ velocity field, derives Q-criterion, writes .vti, renders the isosurface and streamlines.

FEM stress on a notched beam

python scripts/python/fem_stress_field.py

Tetrahedralises the beam, attaches σ + displacement, writes .vtu, renders the von Mises view and the warp-by-vector view.

Volumetric scalar field

python scripts/python/volumetric_scalar.py

96³ procedural plume, GPU volume render with a custom opacity ramp, plus an isocontour view at three levels.

Regenerate all portfolio figures

python scripts/python/render_figures.py

Rebuilds every PNG that ships in /docs/assets — what GitHub Actions runs on every push.

von Mises stress on a notched cantilever beam
von Mises stress on the notched cantilever — note the concentration at the notch root, clipped to the 5–95 percentile band so the field stays readable.

Stack

ParaView

Daily driver since 4.x. State files, pvbatch, pvpython, multi-view layouts, custom transfer functions, programmable filters and sources.

VTK

C++ and Python. Image data, structured/unstructured grids, polydata, vtkAlgorithm subclassing for custom filters. Headless OSMesa rendering for CI.

Plugin development

Server-manager XML proxies, Python plugins, C++ plugins via vtkPVPluginLoader. Shipped plugins to Slurm clusters and Windows workstations.

In-situ & HPC

Catalyst v2 adaptors with Conduit, Catalyst Live for steering. ParaView client–server over MPI. GPU offload via OSMesa / EGL.

Solver formats

OpenFOAM, SU2, CGNS, EnSight Gold, XDMF, Exodus II, NetCDF, HDF5. Ensemble post-processing and time-series analysis.

Code & CI

Python (numpy, scipy, vtk, paraview), C++17. Git, GitHub Actions, Docker. Every analysis is a script — diffable, reviewable, reproducible.

About

I'm a senior scientific-visualization specialist with ten years across ParaView, VTK, and Catalyst, doing CFD and FEM post-processing and in-situ visualization for HPC simulations. I care about reproducible pipelines, transfer functions that don't lie, plugins that ship cleanly, and visualizations that still render the same way a year from now.

Open to remote and contract engagements in scientific visualization, CFD/FEM post-processing, or HPC in-situ workflows. The repository linked below is the living portfolio companion to my CV.